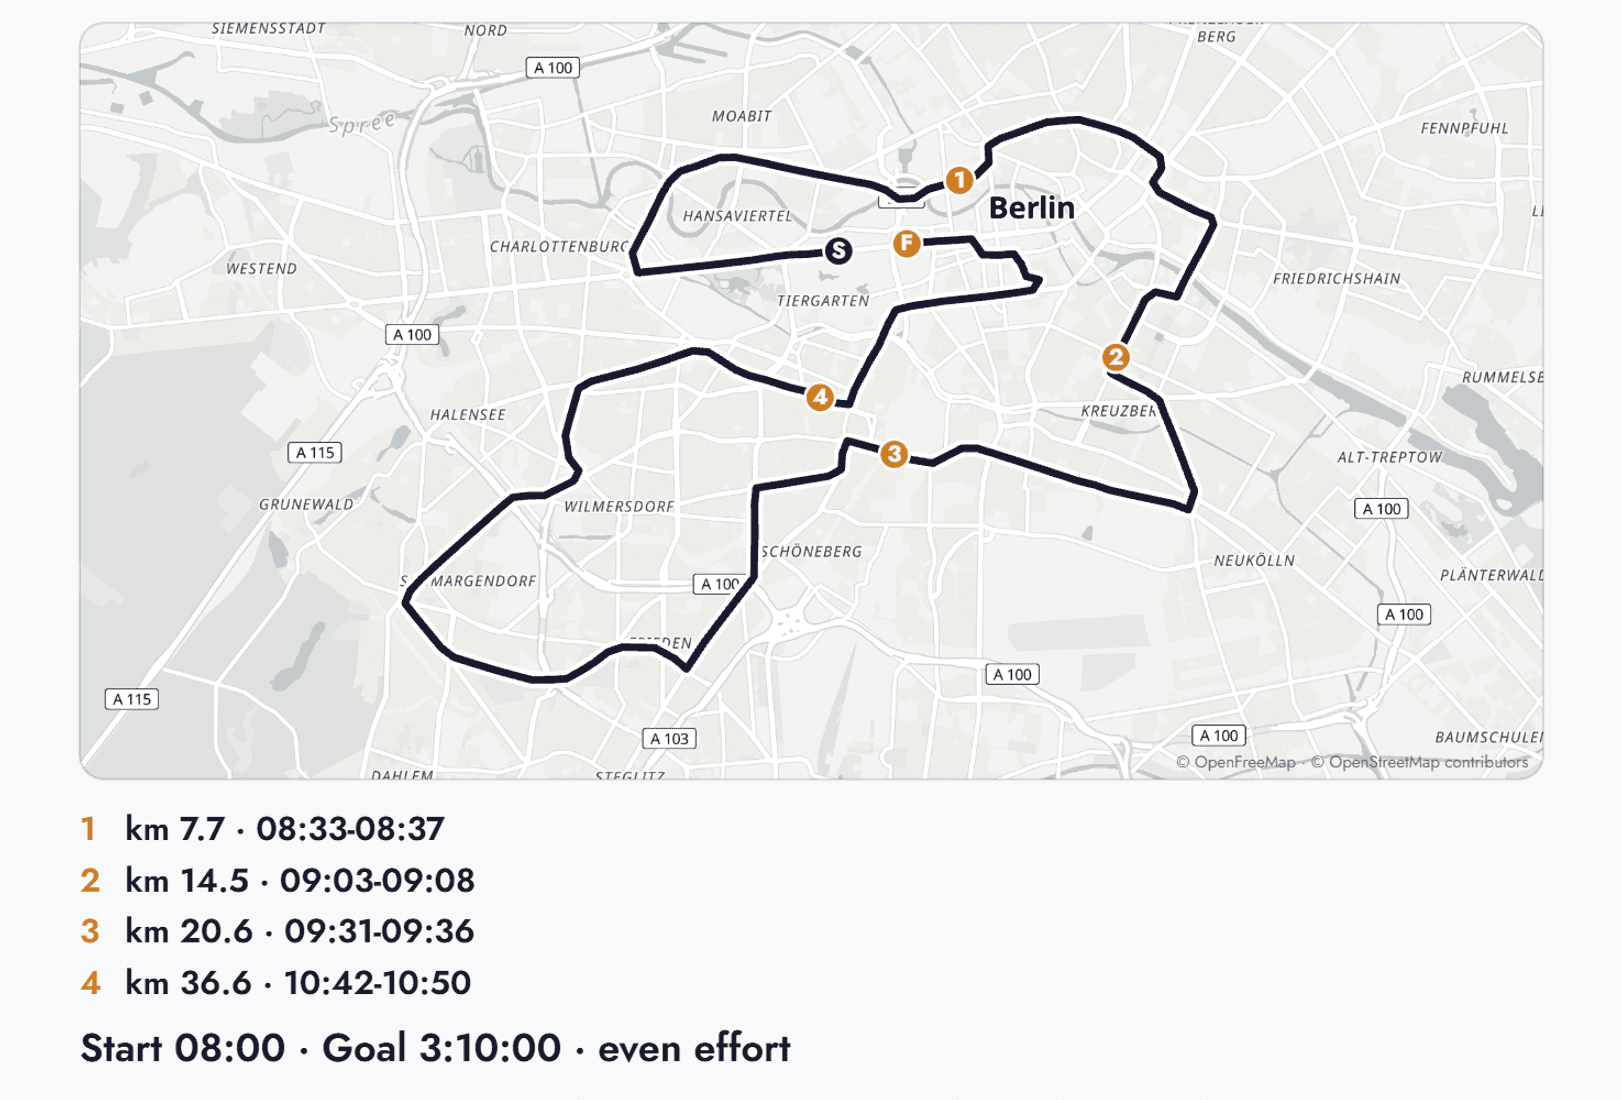
At kilometre 30 of the Berlin Marathon, a runner aiming for 3:45 is somewhere between 2:38:27 and 2:45:00 on the clock. That is a window of six and a half minutes, and anyone waiting with a banner has to be standing there for all of it. Arrive at 2:36 and the runner has not come through yet. Wander off for a coffee at 2:44 and you miss them while you are holding it.
Most pace advice is written for the person running. The people who stand at the side of the road for four hours get a vague "she should be through around 11:50". The MarathonPassport pace and spectator planner was built for both, from the same plan.
The Short Cut
- Even effort is not even pace: hills, a crowded start and a second-half fade all move the splits, so a flat "5:20 per kilometre" plan misses the real times at most points on the course.
- Around 87% of marathon finishers run a positive split, and the average slowdown is about 8%, so the fade to plan for is your own honest estimate.
- A 4% climb costs about 29% more energy per metre than flat ground, while a 4% descent saves only about 21%, which is why rolling courses cost more than flat ones.
- The planner gives a window for every point on the course, never a single time, and the window widens with distance and leans late.
- Build a plan, then tap the course map to pin points: each pin shows when your runner should pass it, so you can choose where to stand and when to move.
- Enter the time you can be at the course and the planner tells you which stretch of road to watch.
- It is a planning estimate and not live tracking, so use it alongside the race's official tracking app.
Even effort is not even pace
A 3:45 marathon averages 5:20 per kilometre. Few runners hold 5:20 on every kilometre of it. The first kilometres go slower in a big field because the road is full. A climb slows you down and a descent only gives part of that back. Late in the race, most runners fade.
The planner treats the goal as a finish time and spreads the effort across the course to hit it. Three things move the splits:
The gradient comes first. The planner reads the course elevation at 100 m steps and adjusts each step for the energy cost of its slope, using the quadratic approximation of the curve measured by Minetti and colleagues in 2002. In that approximation a 4% climb costs about 29% more energy per metre than flat ground, and a 4% descent saves about 21%. The give and take is lopsided. A course that rolls up and down at 4% costs roughly 4% more effort than a flat one of the same length. Gradients are capped at 8% either way, because steeper readings in course data are almost always measurement noise on a road marathon.
The second is the start. Tick the big-field box and the first 3 km are weighted 6% slower, tapering to nothing at 3 km. That is the corral shuffle, and it is the reason your first 5 km split looks slow on a watch that was started at the gun.
The third is the fade, which gets its own section.
You also rate your own hills: easier than most, about average, or harder than most. The setting scales the cost of gradient only, not flat running. Nobody has a reliable population average for how people handle hills, so the planner asks you.
What the second half does to a plan
Around 87% of finishers run a positive split, meaning a slower second half, and the average slowdown is about 8%. The fade is worse at slower finish times. The planner's methodology page draws those figures from large finisher-time analyses of major-city marathons, including Boston field data covering more than 300,000 finishers.
The planner defaults to an even split, 0%, and shows those reference figures next to the input. The default is deliberate. The fade you should plan for is a personal estimate, and a population average pasted in as the default would quietly change every plan. If you faded 6% in your last two marathons, enter 6%. The planner re-solves the whole course so that the first half and second half hit the split you chose and the finish lands on your goal.
The same goal on two courses
Here is the same 3:45 goal, even split, big-field start ticked, on two courses that are in the planner today. The Berlin Marathon is flat, between 31 m and 54 m above sea level. The Athens Marathon runs between 7 m and 247 m and climbs through the middle of the course. Each cell is the central estimate in elapsed time.
| Distance | Berlin | Athens |
|---|---|---|
| 10 km | 0:53:49 | 0:51:23 |
| Halfway | 1:52:30 | 1:52:30 |
| 30 km | 2:40:09 | 2:43:32 |
| 40 km | 3:33:23 | 3:34:18 |
| Finish | 3:45:00 | 3:45:00 |
Both halves of both plans are equal, so halfway is identical. Everything around it is different. The Athens runner is more than two minutes ahead of the Berlin runner at 10 km and more than three minutes behind at 30 km. A spectator who copied the Berlin splits onto Athens would stand at the 30 km point three minutes early and think the runner had been missed. That gap is the cost of a long climb, and it is invisible in a flat average.
Why a window and not a time
The planner never shows a single time. Aid stations, toilet stops, a shoelace and a misjudged fade all push a runner away from any prediction, and most of those push later. So the window is lopsided. At the start line it runs from one minute early to two minutes late. At halfway it is 1 minute 30 seconds early to 4 minutes late. At the finish it is 2 minutes early to 6 minutes late.
For a runner with a goal of 3:45, that means a finish between 3:43:00 and 3:51:00. For a spectator, the lesson is that being early is cheap and being late is expensive. Get to the pin at the start of the window, not the middle.
Tap the map and pin the points
This is the part of the planner for anyone not running. After you press Build plan, the course map appears. Tap anywhere on the line and you get a numbered pin with the distance in kilometres and the window in which your runner should pass it. Tap another. Tap a third. Each pin appears in a list under the map, ordered along the course.
With three or four pins you have a spectating plan. You can see whether the stretch between pin 2 and pin 3 gives you time to get there on the metro, or whether you need to skip one. Where a race has named spectator spots in the planner, including transport notes between them, a pin that lands on one is labelled with its name.
For a different question, scroll to "When can you be at the course?" and enter a clock time. The planner returns the stretch of course your runner could be on at that moment, in kilometres. It answers the question every supporter asks at 10:30 on the day: where do I go if I can only get there by 11:15?
Press Download image and the plan is saved as a picture with the course map, the numbered pins, the windows and the plan summary, ready to send to the person who is running or put on a phone lock screen. Copy plan link shares the plan itself, so whoever opens it sees the same start time, goal and settings.
What it will not do
The planner is not a tracker. It has no GPS, no bib lookup and no connection to the timing mats. It builds a plan from the goal a runner gives it, and the plan is only as good as that goal and the honesty of the fade percentage. The elevation behind it comes from SRTM terrain data, which can misread bridges and tunnels as ground, so the course shape is a chart-quality reference and not a survey. On the day, run the plan and the race's official tracking app side by side. The app tells you where the runner is. The planner tells you where to be before they get there.
Right now the planner is live for the Berlin Marathon and the Athens Marathon, with more races to follow. Look for the pace and spectator planner on a race page, or open the pace and spectator planner and choose a race from the list. If you want to see how the numbers are produced, the methodology page sets out every assumption.
The Extra Mile
Minetti AE, Moia C, Roi GS, Susta D, Ferretti G. Energy cost of walking and running at extreme uphill and downhill slopes. Journal of Applied Physiology. 2002;93(3):1039-1046. The source of the grade-to-energy-cost curve behind the planner's hill adjustment.
How the pace and spectator planner works sets out the grade model, the elevation data limits and the reasoning behind the asymmetric window.
The People Carrying the Balloon: How Official Pacers Shape Race Day covers the pace groups that many runners follow, and which a pace plan can sit alongside.